The Data Behind Donors: Key Metrics to Guide Nonprofit Fundraising
Welcome to the world of nonprofit fundraising metrics, a landscape where understanding and leveraging data transforms how organizations connect with their supporters and fuel their missions. This blog guides you through the crucial metrics that shape your strategy and storytelling, including Average Gift Size, New Donor Retention, Donor Growth Rate, and more.
Each KPI is a piece of a larger puzzle, offering insights into donor behavior, reflecting the impact of your campaigns, and guiding your steps toward deeper engagement and sustainable growth.
As you navigate through these metrics, remember that they are not just numbers on a spreadsheet; their insights on nurturing relationships, celebrating community support, and steering your nonprofit towards sustainable growth and impactful missions. Let’s dive in!
Average gift size
Average gift size represents the average donation amount received within a specific donor group, campaign, or time period. Monitoring how this metric changes over time can provide valuable insights into the success of your fundraising efforts.
What Exactly is Average Gift Size?
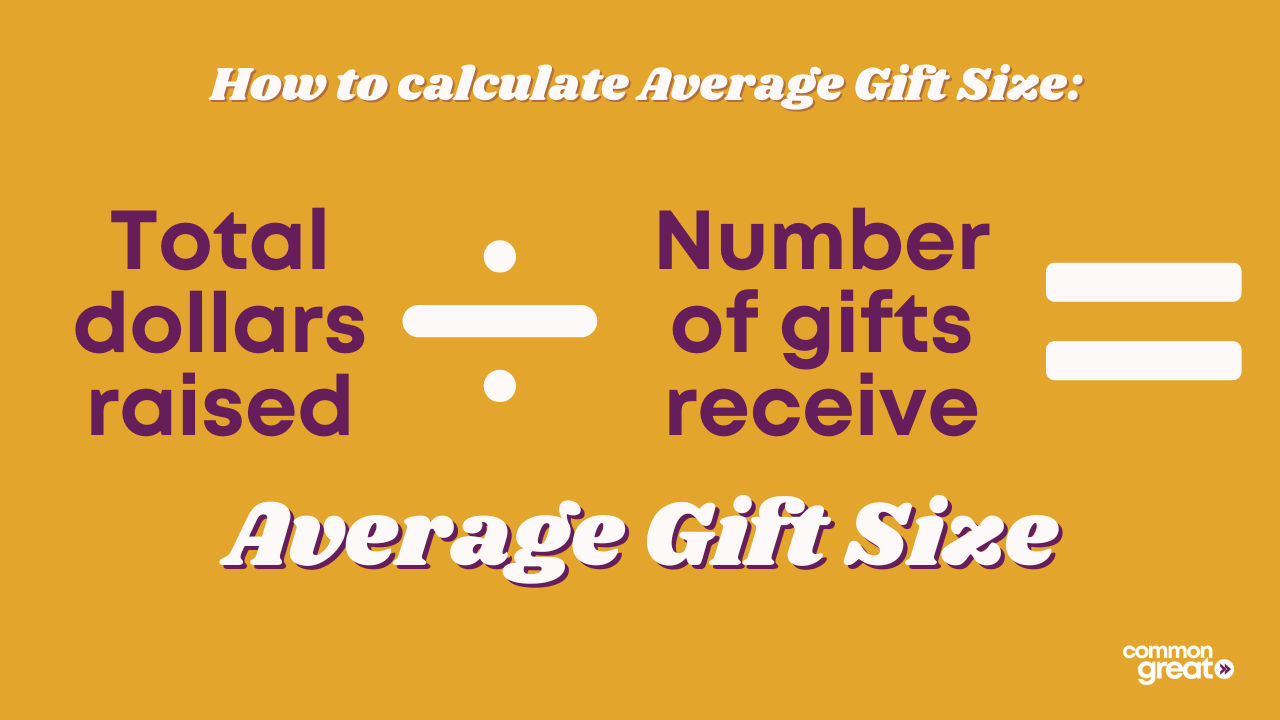
To calculate the average gift size, divide the total dollars raised by the number of gifts received.
For example:
If your organization received $100,000 in donations from 1,000 separate gifts over the past year
Your average gift size would be $100 ($100,000 / 1,000 gifts).
Why Track Average Gift Size?
There are a few key reasons why regularly analyzing your average gift size is important:
Compare Performance Year-Over-Year: Calculate the average gift size during an annual campaign or event and compare it to the previous year to see if you are attracting larger donations.
Evaluate Events/Campaigns: Look at average gift size across different campaigns and events to gauge how well your audience development efforts are working to attract engaged supporters. For example, a lower-than-expected average for a particular event could signal room for improvement in targeting and messaging to resonate better with your ideal donor demographics. Or a rising average gift over multiple years of a repeat event could showcase effective audience building to engage the right donor profiles continually
Identify Trends: Track average gift size consistently over longer periods of time, like annually or semi-annually, to spot overall trends and shifts. A decline may signal issues with your fundraising messaging or economy-related donor struggles.
Tips for Using Average Gift Size
Here are some best practices around utilizing average gift size:
Display on Donation Pages: Share your current average gift size on online and print donation forms. This type of inclusion subtly encourages donors to consider matching or exceeding that benchmark. You can even highlight a specific amount labeled as “most popular” that is modestly higher than the average. People tend to follow trends and donate more when given clear giving tiers. Don’t set the highlighted amount too far beyond your current average or it may deter potential supporters. Gradual, incremental increases tend to work best for growing average donation size.
Don’t Evaluate in Isolation: A lower average gift doesn’t necessarily mean worse performance. If your average size dropped but overall revenue increased, you likely expanded your donor base successfully. Celebrate both metrics!
Avoid Pushing Too High: Be cautious about setting benchmarks too far above your current average gift size. This could deter your current donor base. Incremental growth is okay!
Leave Out Large Outliers: When doing the math on average gift sizes, consider leaving out any huge stand-out donations over a certain dollar amount. Massive one-off donations or bequests can misleadingly inflate overall averages. They matter, but count them separately so unusually high amounts don't conceal patterns in your everyday annual giving trends.
While average gift size is one piece of the puzzle, it’s an accessible metric that provides some good intel on how your fundraising program is evolving. Monitoring it doesn’t take much effort but informs smarter decisions.
New donor retention
Landing that first-time donation from a new supporter feels awesome. But the real win is when that new donor comes back to support your nonprofit again.
Called new donor retention, this KPI measures the percentage of brand-new donors who stick around to give a second or third gift in the following year - or sooner! Let's break it down...
What Exactly is New Donor Retention?
Your new donor retention rate tells you how many first-timers gave a second donation. It might be within the same or the following fiscal year.

To calculate it, look at donors who gave for the first time last year. Then see what percentage of them come back to donate again this year.
For example:
You had 1,000 brand-new donors last year
This year so far, 400 of them have given again
That's a 40% new donor retention rate!
Why Track New Donor Retention?
Measuring your new donor retention rate provides key insights, like:
Effectiveness of your stewardship efforts specifically for first-time donors (which is essential for the long-term health of your donor base)
Which new donor acquisition channels deliver loyal supporters
Loyal repeat donors are the backbone of every thriving nonprofit. They offer reliability and let you spend less on drumming up new supporters.
Plus, research shows the longer a donor sticks with you, the more they give over their lifetime. Getting new donors to return sets them up for deeper ties over time.
Pro Tip: Nurture Those Newbies!
Welcoming new supporters warmly and keeping communication personal prevents first-time dropouts. Share mission updates, steward with care, and ask what matters to them.
Remember - retaining new donors costs less than continually finding new ones. Show some donor love!
Try implementing Common Great’s 60-Day Blueprint for Boosting Donor Retention to build relationships with your new supporters.
Real World Example
Donor retention is a must-track key performance indicator, and it’s one your nonprofit should invest in increasing. Why? Let’s throw it back to high school algebra for a story problem:
Organization A welcomes approximately 250 new donors a year, with an average gift of $25. Their retention rate is only 10% but for the 10% who make a second donation, the average gift size increases to $75. This is an additional $1,875 annually. If they increase their retention rate to 20% or 30%, how much more could they potentially raise?
We won’t make you do the math; that’s just cruel. If Organization A could increase their retention rate to 20%, it would bring in $3,750. Reach a 30% retention rate and the organization could see $5,625. Now imagine the power of higher retention over multiple years - it’s like compound interest that builds on itself.
Number of Gifts Per Donor & Percent of Donors Giving More Than Once Per Year
Landing that first donation feels great. But nonprofit success lies in transforming one-time givers into repeat loyalists.
That’s where two pivotal metrics come in:
Percentage of donors giving more than once per year
Average number of gifts per donor
Let’s dig deeper...
The Power of Repeat Gifts
While initial gifts matter, longevity depends on supporters who give regularly, not just once. Research shows monthly donors retain much longer and give more over time.
Tracking percentages of repeat annual donors and additional average gifts shows who goes beyond the starter pack.
Why It Matters
High repeat donor percentages spotlight are common among organizations successfully cultivating lasting connections via stewardship efforts. More touches per supporter per year strengthen engagement.
The numbers also shine light on areas needing work - what % drops off without further nurturing?
Tips to Boost Repeat Gifts
Getting that first gift is just the start. As explored in our Second Gifts blog, retaining new donors hinges on thoughtful stewardship in those critical early months.
Prompt Acknowledgment: Prioritize sending a personalized thank you letter within 48 hours of a first gift. This immediate recognition makes new donors feel valued and is fundamental stewardship for repeat support.
Automate Stewardship: Implement a tailored 3-5 part New Donor Welcome email sequence when someone gives initially. This scalable yet personalized approach makes a strong first impression laying the foundation for repeat loyalty. Specifically use the series to thank promptly, introduce your mission, connect their gift to outcomes, and showcase community impact.
Donor Multiplicity and Frequency
Nonprofits often default to engaging supporters only once annually, assuming limited annual gifts is the norm. Historically, giving behavior has been rigid with few donation avenues beyond mailing checks during seasonal campaigns. However, the rise in digital and mobile payment methods has fueled more frequent, recurring giving outside limited windows. Reliance on outdated assumptions risks misaligning with how donors prefer to give nowadays.
That's why actively tracking donor multiplicity and frequency as a KPI is so valuable. It reveals actual giving patterns beyond assumptions.
The data reveals a different story. Individual giving patterns are often more varied and active than a single annual gift.
Key discoveries include:
Recurring Gifts Are Increasingly Popular: Donors appreciate the ease of monthly sustainers deducted automatically. Make supporting a favorite cause effortless!
Supporters Are Open to Giving Multiple Times Per Year: Especially for mid-level to major donors, annual gifts quickly multiply into quarterlies.
Passion for Missions Outweighs Communications Fatigue: Despite nonprofit worries, most donors enjoy feeling connected to outcomes they care about deeply.
Pro Tip: How to Amp Up Donor Multiplicity
Move from outdated assumptions to a data-driven understanding of true donor habits. Then adapt engagement approaches accordingly through:
Making sustainer programs more prominent
Providing bite-sized mission updates to inspire second gifts
Testing expanded stewardship cadences
Respecting how donors prefer to give, rather than leaning on assumptions, strengthens relationships and lifts retention. The data guides the way!
Enrollment in monthly/recurring giving
Want a clear snapshot of whether your nonprofit is capitalizing on reliable, set-it-and-forget-it monthly donations?
Measure your recurring donation enrollment rate. This metric shows the percentage of your total donor base that donates via recurring monthly gifts.
What is Recurring Giving Enrollment %?
Recurring giving enrollment simply shows the % of total donors who are signed up for automatic repeat monthly gifts.
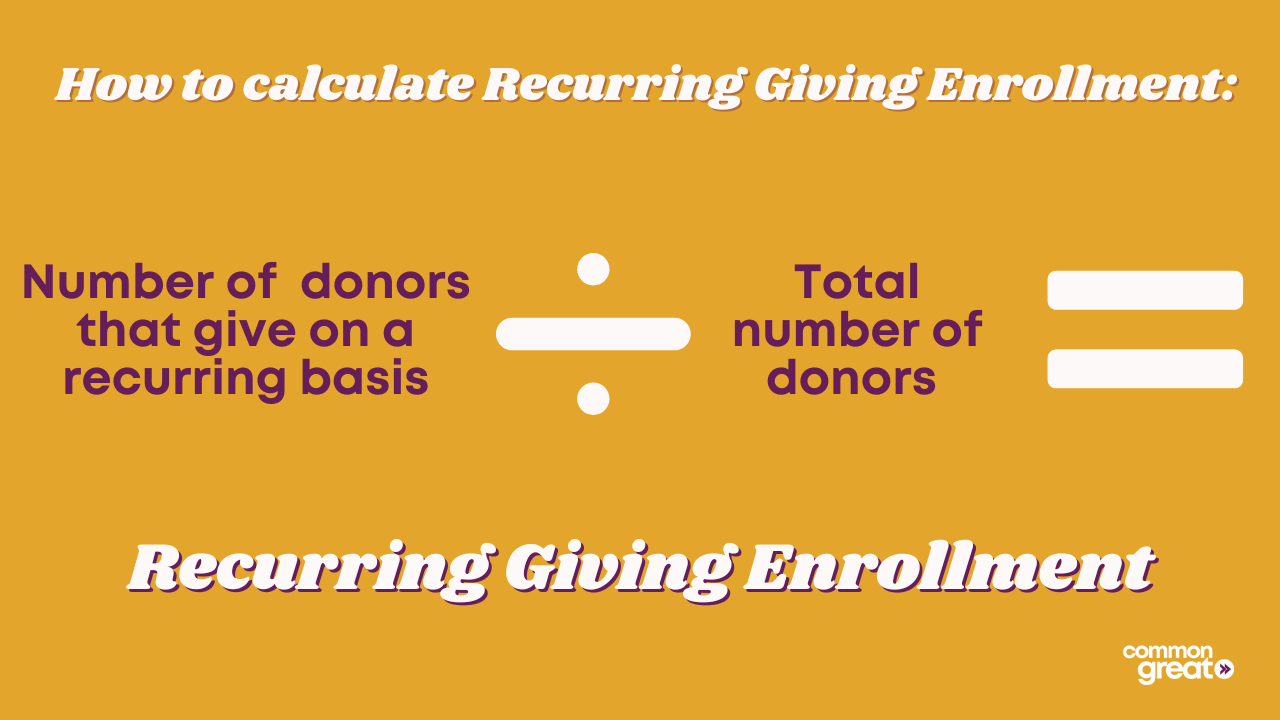
For example:
You have 2,500 total donors
500 donors give monthly
500/2500 = 20% enrollment
Why Track This KPI?
Because recurring supporters are fundraising gold! They offer:
Higher retention rates and lifetime values
Cash flow stability from predictable gifts
Lower admin costs over one-time donors
As the saying goes, what can't be measured can't be managed - gauging enrollment progress year-over-year shows whether monthly donor strategies are working.
Tips for Boosting Monthly Giving Rate
Creative Branding: Devise a creative name and community brand for your sustainer program beyond nondescript “recurring giving”. A unique identity can give supporters a sense of membership and shared commitment to ongoing impact.
Inspire Key Supporters: Highlight monthly giving to loyal repeat donors. Loyalty predicts willingness, and enthusiastic first-timers are still excited from their initial gift. Both groups tend to be receptive.
Spotlight Monthly Giving: Market your nonprofit's recurring monthly giving program just as prominently as one-time annual gift opportunities across all channels and appeals. Consistent visibility and positioning for regular automated gifts will drive higher sign-up rates.
Donor Growth Rate
Want to know if your nonprofit's supporter base is expanding or shrinking? Monitoring your donor growth rate holds the answers.
This simple yet insightful metric shows the percentage increase or decrease in your total number of donors over a defined time period.
Let's explore why it deserves attention.
What is Donor Growth Rate?
Donor growth rate measures the inevitable rise and decline in your overall donor pool across a set timeframe, often from year to year.

Here is how to calculate it:
(Current Year Total Donors - Previous Year Total Donors) / Previous Year Total Donors x 100 = Donor Growth Rate %
For example:
2022 total donors: 500
2023 total donors: 550
(550 - 500) / 500 = 10% growth!
Why Should You Track This Metric?
Donor growth rate quickly indicates the health and trajectory of your nonprofit's supporter engagement efforts. Declines demand attention, while consistent growth is cause for celebration!
Tips Utilizing Donor Growth Rate Insights
Check Engagement Methods: Declining growth rates indicate areas where outreach and messaging may be missing their mark and failing to bring new supporters on board. Conduct targeted surveys to shape better connections.
Pinpoint High Impact Approaches: Dig into growth breakdowns following specific email campaigns, virtual galas, social media campaigns, etc. See which successfully drives expansion vs those showing little return on investment.
Benchmark Your Performance: View donor growth trends internally year-over-year while checking industry benchmarks externally. This fuller picture diagnoses where rates align positively or may be veering off course in need of attention.
Putting Growth in Context
For complete insight, also track related metrics like new donor conversion rates and retention percentages. Together, they show if you are effectively engaging and keeping new supporters.
Donor Acquisition Cost
Snagging new donors is thrilling. But what does it actually cost your nonprofit to attract all those first-time supporters?
Enter donor acquisition cost (DAC) - the amount spent to inspire each new backer. When tracked correctly, this metric spotlights expensive efforts and informs smarter budgeting.
Let's explore why DAC matters.
What is Donor Acquisition Cost?
Donor acquisition cost is the total expenditures devoted to securing new supporters divided by the number of new donors.

For example:
In a campaign:
You spent $2,000 on an email campaign
It attracted 100 first-time donors
$2,000 / 100 = $20 DAC
In advertising:
You spent $5,000 on Google Ads
150 donors clicked from paid search
$5,000 / 150 = $33 DAC
Why Track This Metric?
Monitoring DAC provides crucial insights like:
Seeing which outreach delivers donors efficiently
Understanding true costs to budget correctly
Assessing when to shift strategies if costs climb
Comparison of which acquisition streams work best
It also allows useful comparison - is your DAC aligned with industry benchmarks?
Pro Tip: Context Counts!
DAC alone doesn't tell the whole story. You should also track total new donors over time and retention rates. Together, these metrics spotlight how efficiently you are investing in growth.
Just like in the for-profit sector, the cost to acquire vs. retain customers comes into play. Retaining loyal donors reduces expenses.
Restricted vs Unrestricted Gifts
Nonprofits rely on donor contributions to fuel their mission. However, not all donations confer the same flexibility. Tracking the percentage of restricted vs. unrestricted gifts reveals critical funding breakdowns.
Let’s explore why it matters:
Defining Restricted vs. Unrestricted
Restricted gifts come earmarked by donors for specific programs or uses. Unrestricted dollars have no strings attached and can cover general operations.
On the surface, all donations look good! But a high reliance on restricted support can impede flexibility even amidst seemingly solid fundraising revenue.
Too many restricted large gifts limit leaders’ ability to steer spending based on priorities. An overload of narrow program funding also risks shortchanging fixed infrastructure costs like staff salaries or rent.
Pro Tip: Aim for Balance!
Track this KPI over quarters and years. Notice if earmarked funds dominate? Brainstorm ways to grow unrestricted giving through appeals highlighting flexibility or general operations funds.
Maintain a balance between both designations. Unrestricted empowers decision-making aligned with evolving needs - including paying your team!
Final Thoughts on Fundraising KPIs
Whew! After diving into all these metrics, is your head swimming with ideas and calculations like mine? If you said yes, that’s what we love to hear! Now that you've got a handy guide to the key data points, you’re ready to take your nonprofit fundraising to the next level.
Let’s recap the headlines:
Diligently tracking indicators like donation size, donor retention, and e-mail click rates provides invaluable clarity to diagnose communication gaps or opportunities for refinement.
Solid metrics steer smarter operational choices rooted in supporter behavior insights rather than assumptions.
KPIs form the foundation for time, budget, and resource investments across acquisition campaigns, stewardship enhancements, and other spheres.
While we love our KPIs and their valuable quantitative lessons, remember to stay grounded in genuine qualitative exchanges with donors and community members. Ask them questions, and gather first-hand perspectives on aspirations and critique. Combined with the roadmap provided by data analysis, these supporter stories uplift values that equally shape meaningful connections.
Ultimately, nonprofits relying strictly on one at the exclusion of the other risk misaligned efforts. Balancing both data tracking and community connections provides the clearest path to engaging people-centered growth.
Consistently tracking these performance indicators provides clarity to actively propel your mission. So let's get number crunching - it's time to harness these KPIs to unlock smarter decisions and supporter growth!
This blog post was authored by Common Great Consultant, Caroline Rensel. Learn more about Caroline here and click here to book a Power Session with her. A Power Session is a 60-minute, on-demand meeting that can be used to address your nonprofit’s priorities, ask questions, discuss barriers, and more.